Lake District Climate Report: Sixty Years After Wainwright
Alfred Wainwright finished the last of his Pictorial Guides — Book Seven, The Western Fells — in April 1966. Sixty years on, the fells he drew are measurably warmer, wetter and less often white. This report puts sourced, dated numbers on how much — and what it means for the people still walking them. Every figure names its baseline and its basis, ranges are shown as ranges, and causes are attributed to the studies that found them, never asserted as our own.
Sixty years after Wainwright — warmer, wetter, less white, every figure sourced and dated.
Before the numbers
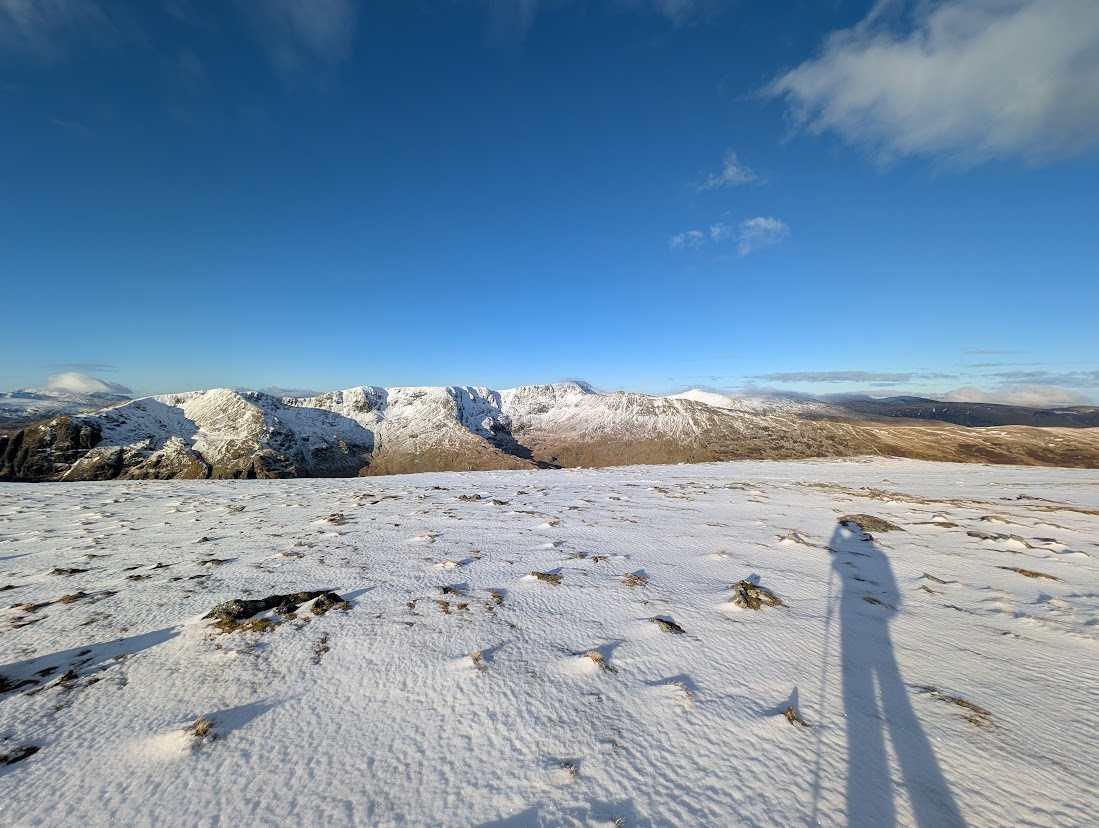
From personal experience I’ve been caught out in heavy downpours and thick snow. But recently I was sat looking at my photos of the Lakeland fells, thinking how many from this year seemed to be mostly blue with clear sky, while so many of the older ones were shrouded in the grey of clag. Surely the climate hasn’t been improving — perhaps I’m just getting softer, and only tend to venture out when there’s a chance of a suntan and a long-distance view?
It got me thinking: how is the weather — or the climate, more accurately — actually different since Wainwright stopped writing his Pictorial Guides sixty years ago? He wrote his books for the “ordinary pedestrian” and advised against venturing out in excessively inclement weather — but how much need is there now to give the same warnings the great man did last century?
Read this first
This is a data report, not a campaign. Every figure comes from a published source, is dated, and is tagged with the kind of data it is — observed gridded records, a national statement, an attribution study, or a modelled projection. They are not interchangeable, and single storms or single warm years are weather, not proof of a trend — see methodology.
The headline numbers
Measured against Wainwright’s decade (1956–65) on the Met Office district series that contains the Lake District, the direction is unambiguous — and each of these carries its baseline, its basis and its confidence. The dashed cards are the ones to read most carefully: attributed findings and modelled projections, not observed records.
Every figure here is a regional gridded average or an attributed/modelled value — not a reading from any summit. Read them with the methodology in mind.
The fells Wainwright drew
When Wainwright was completing the Pictorial Guides, the closest measurable picture of the climate is the 1961–1990 standard normal — a district mean of about 8.39 °C a year, against roughly 9.21 °C for 1991–2020. His drawings of snow-choked gullies and his notes on winter conditions are testimony to what those winters felt like, and we treat them as exactly that: testimony, not data. No quantitative claim in this report rests on the guidebooks; the numbers come from the instruments.
Warmer
The district’s mean annual temperature has climbed from about 8.39 °C in the 1961–90 normal to 9.21 °C in 1991–2020, and the most recent decade is warmer still. The two warmest years in the whole 1884–2025 record are 2023 and 2025, and the warmest years cluster in the last decade-plus — though, as ever, no single year makes a climate. What warmer, drier summers mean on the ground — heat, fire risk, dogs on warm walks, cold-water shock on hot days — is ranked by evidence in Summer on the Fells.
Show the data table
| Year | Anomaly vs 1961–90 | 10-yr mean (°C) |
|---|---|---|
| 1966 | -0.08 °C | 8.36 |
| 1967 | +0.08 °C | 8.31 |
| 1968 | -0.10 °C | 8.30 |
| 1969 | -0.28 °C | 8.18 |
| 1970 | +0.09 °C | 8.16 |
| 1971 | +0.44 °C | 8.18 |
| 1972 | -0.26 °C | 8.23 |
| 1973 | +0.17 °C | 8.34 |
| 1974 | +0.06 °C | 8.35 |
| 1975 | +0.46 °C | 8.45 |
| 1976 | +0.37 °C | 8.49 |
| 1977 | -0.03 °C | 8.48 |
| 1978 | -0.05 °C | 8.49 |
| 1979 | -0.72 °C | 8.44 |
| 1980 | -0.04 °C | 8.43 |
| 1981 | -0.24 °C | 8.36 |
| 1982 | +0.35 °C | 8.42 |
| 1983 | +0.52 °C | 8.46 |
| 1984 | +0.32 °C | 8.48 |
| 1985 | -0.49 °C | 8.39 |
| 1986 | -0.64 °C | 8.29 |
| 1987 | -0.33 °C | 8.26 |
| 1988 | +0.44 °C | 8.31 |
| 1989 | +0.93 °C | 8.47 |
| 1990 | +1.13 °C | 8.59 |
| 1991 | +0.24 °C | 8.64 |
| 1992 | +0.42 °C | 8.64 |
| 1993 | -0.01 °C | 8.59 |
| 1994 | +0.53 °C | 8.61 |
| 1995 | +0.98 °C | 8.76 |
| 1996 | -0.17 °C | 8.81 |
| 1997 | +1.11 °C | 8.95 |
| 1998 | +0.95 °C | 9.00 |
| 1999 | +1.17 °C | 9.03 |
| 2000 | +0.79 °C | 8.99 |
| 2001 | +0.46 °C | 9.01 |
| 2002 | +1.04 °C | 9.07 |
| 2003 | +1.09 °C | 9.19 |
| 2004 | +1.10 °C | 9.24 |
| 2005 | +1.12 °C | 9.26 |
| 2006 | +1.39 °C | 9.41 |
| 2007 | +1.24 °C | 9.43 |
| 2008 | +0.72 °C | 9.40 |
| 2009 | +0.75 °C | 9.36 |
| 2010 | -0.49 °C | 9.23 |
| 2011 | +1.28 °C | 9.31 |
| 2012 | +0.43 °C | 9.25 |
| 2013 | +0.38 °C | 9.18 |
| 2014 | +1.55 °C | 9.23 |
| 2015 | +0.83 °C | 9.20 |
| 2016 | +1.03 °C | 9.16 |
| 2017 | +1.25 °C | 9.16 |
| 2018 | +1.09 °C | 9.20 |
| 2019 | +1.03 °C | 9.23 |
| 2020 | +1.27 °C | 9.40 |
| 2021 | +0.98 °C | 9.37 |
| 2022 | +1.67 °C | 9.50 |
| 2023 | +1.76 °C | 9.64 |
| 2024 | +1.44 °C | 9.63 |
| 2025 | +1.71 °C | 9.71 |
Wetter, and more violent
Total rainfall has edged up — about 6.2% between the two standard normals, and roughly 14% wetter in the last decade than in Wainwright’s — but the sharper change is in the extremes. Both of the most recent UK 24-hour rainfall records were set on Lakeland fells, six years apart. The Met Office makes the same point nationally: across recent decades a growing share of the UK’s rain has fallen in intense bursts rather than steady days (Met Office / State of the UK Climate (opens in new tab)).
Show the data table
| Year | Rainfall (mm) | 10-yr mean (mm) |
|---|---|---|
| 1966 | 1368.6 | 1262.1 |
| 1967 | 1470.9 | 1275.2 |
| 1968 | 1267.9 | 1271.3 |
| 1969 | 1154.8 | 1273.4 |
| 1970 | 1308.0 | 1261.2 |
| 1971 | 1029.8 | 1236.5 |
| 1972 | 1201.9 | 1237.0 |
| 1973 | 1086.0 | 1231.0 |
| 1974 | 1385.5 | 1261.4 |
| 1975 | 1066.6 | 1234.0 |
| 1976 | 1081.2 | 1205.3 |
| 1977 | 1299.3 | 1188.1 |
| 1978 | 1218.7 | 1183.2 |
| 1979 | 1331.8 | 1200.9 |
| 1980 | 1409.2 | 1211.0 |
| 1981 | 1421.8 | 1250.2 |
| 1982 | 1368.1 | 1266.8 |
| 1983 | 1297.5 | 1288.0 |
| 1984 | 1195.8 | 1269.0 |
| 1985 | 1252.4 | 1287.6 |
| 1986 | 1390.1 | 1318.5 |
| 1987 | 1300.4 | 1318.6 |
| 1988 | 1367.1 | 1333.4 |
| 1989 | 1171.9 | 1317.4 |
| 1990 | 1319.0 | 1308.4 |
| 1991 | 1152.5 | 1281.5 |
| 1992 | 1326.0 | 1277.3 |
| 1993 | 1246.6 | 1272.2 |
| 1994 | 1437.5 | 1296.3 |
| 1995 | 1086.7 | 1279.8 |
| 1996 | 1020.8 | 1242.8 |
| 1997 | 1157.3 | 1228.5 |
| 1998 | 1491.8 | 1241.0 |
| 1999 | 1448.2 | 1268.6 |
| 2000 | 1690.5 | 1305.8 |
| 2001 | 1175.2 | 1308.1 |
| 2002 | 1467.5 | 1322.2 |
| 2003 | 1070.1 | 1304.6 |
| 2004 | 1396.8 | 1300.5 |
| 2005 | 1206.5 | 1312.5 |
| 2006 | 1395.7 | 1350.0 |
| 2007 | 1357.0 | 1369.9 |
| 2008 | 1547.7 | 1375.5 |
| 2009 | 1358.6 | 1366.6 |
| 2010 | 1025.9 | 1300.1 |
| 2011 | 1332.8 | 1315.9 |
| 2012 | 1624.7 | 1331.6 |
| 2013 | 1198.4 | 1344.4 |
| 2014 | 1368.7 | 1341.6 |
| 2015 | 1529.7 | 1373.9 |
| 2016 | 1299.5 | 1364.3 |
| 2017 | 1401.8 | 1368.8 |
| 2018 | 1176.8 | 1331.7 |
| 2019 | 1502.7 | 1346.1 |
| 2020 | 1643.5 | 1407.9 |
| 2021 | 1399.7 | 1414.5 |
| 2022 | 1233.7 | 1375.5 |
| 2023 | 1607.7 | 1416.4 |
| 2024 | 1548.6 | 1434.4 |
| 2025 | 1328.5 | 1414.2 |
Show the data table
| Record | Location | 24-hour total | Event | Source |
|---|---|---|---|---|
| current UK record | Honister Pass | 341.4 mm | Storm Desmond | World Weather Attribution (opens in new tab) |
| previous UK record | Seathwaite | 316.4 mm | November 2009 Cumbria floods | World Weather Attribution (opens in new tab) |
Are those records down to climate change? The honest, attributed answer is a qualified yes — and the honesty is in the range. World Weather Attribution (opens in new tab)’s real-time analysis of Storm Desmond estimated that climate change had made rainfall of that kind about 40% more likely, with a 5–80% uncertainty range. The peer-reviewed revisit (Otto et al. 2018 (opens in new tab)) raised the central estimate to about 59% — but on more data its uncertainty grew, to a range that includes no change at all and reaches up to +250%. Both are the study’s own figures, shown with their ranges: a real signal, but not a certainty, and not ours to assert.
Placed against the long run, the recent floods genuinely stand out. A lake-sediment reconstruction from Bassenthwaite Lake found the 2009 and 2015 floods among the largest in roughly 550 years of record (Chiverrell et al. 2019 (opens in new tab)) — physical evidence layered in the lakebed, not a model.
What the water did is not abstract: Storm Desmond flooded thousands of homes and, for walkers, severed valley access — the A591 at Dunmail Raise was washed out and closed for months, and bridges across the Park were lost.
Less white
This is the section where honesty matters most, because the ideal dataset — a continuous record of snow lying on the summits — does not exist for the Lakeland fells, and we won’t invent one. What we can show is the observed proxy: air-frost days across the district are down about 35% since Wainwright’s decade. Less frost means less of the freeze-thaw that firms the ground and holds snow — fewer reliable ice-axe-and-crampon days.
Show the data table
| Year | Air-frost days | 10-yr mean |
|---|---|---|
| 1966 | 48.4 | 60.3 |
| 1967 | 46.9 | 60.8 |
| 1968 | 73.4 | 61.0 |
| 1969 | 83.7 | 64.8 |
| 1970 | 67.2 | 65.5 |
| 1971 | 48.3 | 65.5 |
| 1972 | 41.6 | 62.4 |
| 1973 | 59.7 | 60.1 |
| 1974 | 34.1 | 57.4 |
| 1975 | 50.9 | 55.4 |
| 1976 | 59.8 | 56.6 |
| 1977 | 47.2 | 56.6 |
| 1978 | 61.6 | 55.4 |
| 1979 | 84.5 | 55.5 |
| 1980 | 59.3 | 54.7 |
| 1981 | 69.2 | 56.8 |
| 1982 | 53.5 | 58.0 |
| 1983 | 52.3 | 57.2 |
| 1984 | 52.9 | 59.1 |
| 1985 | 76.2 | 61.6 |
| 1986 | 65.4 | 62.2 |
| 1987 | 67.4 | 64.2 |
| 1988 | 35.8 | 61.7 |
| 1989 | 39.6 | 57.2 |
| 1990 | 30.7 | 54.3 |
| 1991 | 58.7 | 53.2 |
| 1992 | 47.3 | 52.6 |
| 1993 | 50.7 | 52.5 |
| 1994 | 37.1 | 50.9 |
| 1995 | 57.0 | 49.0 |
| 1996 | 76.6 | 50.1 |
| 1997 | 42.9 | 47.6 |
| 1998 | 37.2 | 47.8 |
| 1999 | 35.4 | 47.4 |
| 2000 | 35.7 | 47.9 |
| 2001 | 69.5 | 48.9 |
| 2002 | 31.1 | 47.3 |
| 2003 | 57.7 | 48.0 |
| 2004 | 43.3 | 48.6 |
| 2005 | 49.5 | 47.9 |
| 2006 | 47.5 | 45.0 |
| 2007 | 36.5 | 44.3 |
| 2008 | 51.0 | 45.7 |
| 2009 | 50.9 | 47.3 |
| 2010 | 94.1 | 53.1 |
| 2011 | 37.5 | 49.9 |
| 2012 | 47.8 | 51.6 |
| 2013 | 72.3 | 53.0 |
| 2014 | 22.3 | 50.9 |
| 2015 | 37.2 | 49.7 |
| 2016 | 47.1 | 49.7 |
| 2017 | 41.3 | 50.2 |
| 2018 | 47.2 | 49.8 |
| 2019 | 40.1 | 48.7 |
| 2020 | 28.6 | 42.1 |
| 2021 | 60.3 | 44.4 |
| 2022 | 38.3 | 43.5 |
| 2023 | 37.4 | 40.0 |
| 2024 | 30.7 | 40.8 |
| 2025 | 38.5 | 41.0 |
Set beside that observed local signal, the national picture agrees: the Met Office reports that lying snow and air frost have declined across the UK (Met Office / State of the UK Climate (opens in new tab) — a national statement, labelled as such). A Lake-District-specific snow index, compiled from the LDNPA Fell Top Assessor archive, is a planned future addition; until it exists, we rest the ‘less white’ story on frost and the national finding, and say so.
What it’s doing to the fells
The changes above are already reshaping the ground underfoot. Fix the Fells — the Lake District National Park and National Trust partnership — estimates about 630 km of mountain path need repair over the coming decade, naming footfall and extreme weather on thin upland soils as the drivers (Fix the Fells (opens in new tab)). In the valleys, Windermere’s surface waters have warmed about +1.5 °C over roughly 80 years of monitoring since 1945 (UKCEH (opens in new tab)), clearest in spring and early summer — one of the longest continuous local physical records there is.
What this means for you
Read as a walker rather than a statistician, the data is a quiet safety briefing — each trend maps onto a decision you can make before you leave the car:
- Treat winter as less predictable, not milder. Fewer frost days means more marginal, thaw-and-refreeze conditions. Check the live conditions and the mountain forecast on the day, and carry winter kit later into spring and earlier into autumn than the calendar — or an old trip report — suggests.
- Respect the rain. More intense downpours put ghylls and fords in spate faster; plan crossings with escape options, and think hard about route choice on a storm day.
- Plan for heat on the big rounds. Warmer summers mean water, timing and an early start matter more — and our mountain rescue report found 78% of call-outs come after midday.
- Stick to the repaired line. Eroded and rerouted paths are the visible edge of this; the ‘fragile edges’ plea from Fix the Fells is a real one.
New to any of this? Our guides to navigation, first aid on the fells and starting out are built around exactly these decisions, and the fell pages for Helvellyn and Scafell Pike carry their own conditions and access notes.
The longer view & our take
Two hundred years of records for the central Lakes show that rainfall here has always been hugely variable — which is precisely why a trend has to be separated from the noise, and why we lean on smoothed decades rather than headline years. Looking forward, the Met Office’s UKCP18 projections point the same way as the observations: under a high-emissions scenario, UK winters up to 40% wetter and 3.4 °C warmer by 2070, with hotter, drier summers (Met Office UKCP18 (opens in new tab)). Those are modelled projections under a named scenario, at UK scale — not measurements, and not Lake-District-specific.
Locally, the response is catching up with the science: the Lake District National Park Authority now treats climate change as the single biggest long-term driver of change facing the area (Lake District National Park (opens in new tab)), and the Fix the Fells partnership is repairing the path erosion that heavier rain accelerates.
Our view
I often see people out in the wrong gear, in weather they cannot control. It frustrates me that when my water line is freezing at −3 °C, others are on the summits in tracksuit bottoms, thin jackets and trainers — while I’ve got my heavy boots on, winter Montane trousers, a Keela jacket, heavy mittens and hot coffee ready in a flask.
But it’s not just snowy weather. It’s the rain you can’t see through that people aren’t prepared for — the kind that has mountain rescue teams risking their lives to bring them home. The climate is visibly getting less predictable, in the wind and rain as much as the snow. Far too many still picture bad weather as the odd flood or heavy snow shower; but as the weather becomes less certain, we need to be better at reading it in situ, and better prepared for when the unexpected does happen.
Methodology, sources & gaps
The rules that govern every figure
- Baseline discipline. Every comparison names its baseline — the 1961–1990 and 1991–2020 standard normals, or Wainwright’s 1956–65 decade. A single year is never compared to a normal and called a trend.
- Data-type discipline. Observed gridded data (HadUK-Grid) is not the same as a national statement, an attribution study, or a projection. Every chart is labelled with which it is.
- Weather is not climate. Single storms and single warm years show the direction of change but prove nothing alone; attribution studies are the bridge, and their uncertainty ranges are always shown.
- Attribution is the study’s, not ours. Causal claims are attributed to the body making them (World Weather Attribution, the Met Office, Fix the Fells), never asserted as our own finding.
- Name the span. The temperature series runs from 1884, rainfall from 1961 (sampled back to 1836), air frost from 1931 — not a single continuous sixty-year fell-top record. There is no continuous summit-observed climate series for the fells.
Known gaps, stated plainly
- The temperature, rainfall and frost series are gridded area-averages for the England NW & N Wales district - a region much larger than the fells. They describe the regional climate the Lake District sits within, not the weather on any summit. There is no continuous long-run summit-observed climate series for the fells.
- Series spans differ: temperature from 1884, rainfall used from 1961 (with sparse earlier sample years back to 1836), air frost from 1931. Name the span whenever a figure is quoted; do not imply a single continuous 60-year fell-top record.
- Single events (Storm Desmond) and single years (2023, 2025) illustrate the direction of change but are weather, not proof of climate trend.
- Attribution figures (Desmond ~40%, 5-80%) are the studies' findings and carry real uncertainty - always shown as a range and attributed to World Weather Attribution / Otto et al.
- Projections (UKCP18) are modelled, scenario-dependent and UK-scale, not observations and not downscaled to the fells here.
- Lake-temperature figures are for named lakes (Windermere) from UKCEH, not the fells; included as an adjacent, well-observed indicator.
- Two figures were corrected during compile to a single consistent district basis: warming vs the Wainwright decade is +1.38 C (not +1.53 C), and the claim 'the four warmest years are the last four in order' was dropped (2014 is among the four warmest).
Sources
Every figure above traces to a published source. Full list:
- HadUK-Grid areal series - mean air temperature, England NW & N Wales district (opens in new tab) — Met Office (National Climate Information Centre), updated 2026. Mean annual temperature series 1884-2025; 1961-1990 normal 8.39 C; 1991-2020 normal 9.21 C; decade and warmest-year figures
- HadUK-Grid areal series - rainfall, England NW & N Wales district (opens in new tab) — Met Office (National Climate Information Centre), updated 2026. Annual rainfall series; 1961-1990 normal 1260 mm; 1991-2020 normal 1338 mm; wettest-year figures
- HadUK-Grid areal series - days of air frost, England NW & N Wales district (opens in new tab) — Met Office (National Climate Information Centre), updated 2026. Air-frost days per year 1931-2025; -35% since the Wainwright decade
- Storm Desmond brings heavy rain to the UK, December 2015 (opens in new tab) — World Weather Attribution, 16 Dec 2015 (peer-reviewed 2018). Honister Pass 341.4 mm 24-hour UK record; previous record Seathwaite 316.4 mm (2009); attribution ~40% more likely (5-80% range)
- Climate change increases the probability of heavy rains like those of storm Desmond in the UK - an event attribution study in near-real time (opens in new tab) — Otto, F.E.L. et al., Environmental Research Letters, 2018. Peer-reviewed basis for the Desmond attribution result
- Fix the Fells appeal - caring for the Lake District's mountain paths (opens in new tab) — Fix the Fells (Lake District National Park / National Trust partnership), accessed 3 Jul 2026. "630km of paths will need to be repaired within the next 10 years" (verified verbatim on the Fix the Fells appeal page, 3 Jul 2026); erosion from footfall + extreme weather on thin upland soils. The ~GBP 650,000/year running-cost figure is a stated programme estimate, not confirmed verbatim on this page.
- Using lake sediment archives to improve understanding of flood magnitude and frequency: recent extreme flooding in northwest UK (opens in new tab) — Chiverrell, R.C. et al., Earth Surface Processes and Landforms, 2019. Lake-sediment flood record (Bassenthwaite): the 2009 and 2015 NW England floods among the largest in roughly 550 years of record. (Primary abstract paywalled; finding + citation confirmed via the study's press coverage and DOI, 3 Jul 2026. The separate '1-in-1300-year' Honister figure was NOT confirmed to this study and is deliberately omitted.)
- Climate action in the Lake District (opens in new tab) — Lake District National Park Authority, accessed 3 Jul 2026. The Park Authority treats climate change as the single biggest long-term driver of change facing the Lake District (substance verified; paraphrased, not quoted verbatim)
- Lakes in hot water: warming trend revealed in eight decades of Cumbrian lake temperature records (opens in new tab) — UK Centre for Ecology & Hydrology, accessed 2 Jul 2026. Windermere surface waters ~1.5 °C warmer over ~80 years (record from 1945); clearest in spring/early summer
- UKCP18 headline findings (land) (opens in new tab) — Met Office (UK Climate Projections 2018), v4, Aug 2022. By 2070 under high emissions: winters up to 3.4 °C warmer / 40% wetter; summers up to 5.1 °C hotter / 44% drier; rain intensity up to 25% winter / 20% summer
- State of the UK Climate (opens in new tab) — Met Office / RMetS (Int. J. Climatology), annual. National context on declining lying snow and air frost (the 'less white' national statement) — confirm the exact latest figure at build time
Spot a data error? Request a correction — every figure here is sourced and dated, and genuine mistakes are fixed promptly.
Frequently asked questions
How has climate change affected the Lake District?
On the Met Office district series that contains the Lake District, the fells are measurably warmer, wetter and less frosty than in Wainwright’s day: the last decade is about +1.38 °C warmer and 14% wetter than 1956–65, with roughly 35% fewer air-frost days. Extreme rain has hit hard too — both of the most recent UK 24-hour rainfall records were set on Lakeland fells. These are regional gridded figures, not summit readings; every one is dated and sourced below.
Is the Lake District getting warmer?
Yes. The district’s 30-year normal rose from 8.39 °C (1961–90) to 9.21 °C (1991–2020), about +0.81 °C; the most recent decade is warmer still, roughly +1.38 °C above Wainwright’s. 2023 and 2025 are the two warmest years in the 1884–2025 record, and the warmest years cluster in the last decade-plus. Source: Met Office HadUK-Grid.
Is the Lake District getting wetter?
On the smoothed trend, yes — the district’s annual rainfall normal rose about 6.2% between the two standard baselines, and the last decade is roughly 14% wetter than Wainwright’s, with the five wettest years on record all falling this century. Rainfall is very noisy year to year, though, so the trend is read from the 10-year running mean, not any single wet or dry year.
Does it still snow in the Lake District — is there less than there used to be?
The honest answer for now rests on frost, not snow. There is no continuous, summit-level snow record for the Lakeland fells, so we don’t fake one. What the observed data does show is air-frost days down about 35% since Wainwright’s decade, and the Met Office reports lying snow declining nationally. A Lake-District-specific snow index (from the Fell Top Assessor archive) is a planned future addition, clearly labelled when it lands.
What was the wettest day ever recorded in the UK?
The UK’s highest 24-hour rainfall total is 341.4 mm at Honister Pass in the Lake District, over 4–5 December 2015 during Storm Desmond. It broke the previous record of 316.4 mm set at Seathwaite, also in the Lakes, in 2009 — two national records, six years apart, both on Lakeland fells.
Is it safe to hike the Lake District in winter now?
Winter walking is as serious as ever — arguably trickier, because conditions are less reliable, not gentler. Fewer frost days means more freeze-thaw and more marginal days, so treat old guidebook and trip-report snow expectations as history, check the conditions on the day (our live conditions and the mountain forecast), and carry winter kit later into spring and earlier into autumn than the calendar suggests. See our navigation and first-aid guides.
Cite or embed this report
Cite this report:
hikes.guide, “Lake District Climate Report: Sixty Years After Wainwright” (2025 data), https://hikes.guide/features/lake-district-climate-report.html (accessed [date]).
Download the data: the full figure-by-figure dataset is a public CSV — download climate-stats.csv (every row carries its year or period, basis, baseline, confidence and source).
Embed a chart: each chart above has an “Embed this chart” option with ready-made code. Please keep the “Source: hikes.guide” credit.
Grab the citation (HTML): paste this to credit the report with a link back.
Media & data enquiries: lee@hikes.guide — journalists and teams are welcome to use these figures; the full CSV and per-chart embeds are above.
This report is reviewed and refreshed each July, when the Met Office publishes its State of the UK Climate for the previous year. A few figures are flagged for a primary-source check before each release. Spotted something that looks wrong? Please use the Report a Problem link in the footer — corrections are always welcome. Last updated 2 July 2026.