The Lake District in October
An average October on the Lakeland fells gives you 11.7 dry days, of which 9.5 are sunny. That makes it the 6th driest of the twelve. This page is what 11 years of weather records and a council parking return say about coming here now.
What the weather usually does
Across 2015-01-01 to 2025-12-31 — 4,018 days — October averaged 11.7 dry days against a twelve-month average of 12.2, and 9.5 sunny days against an average of 10.5. A dry day is one with under a millimetre of rain; a sunny day is a dry one with at least four hours of sunshine.
October ranks 6th of twelve for dry days and 8th for sunny ones. The driest month of the year is April — there is a whole article on why that is not the month most people come.
Four walks for October
Chosen for the light this month rather than for a forecast, and signed off one by one. Each links to the full route with its stages, parking and escape options.

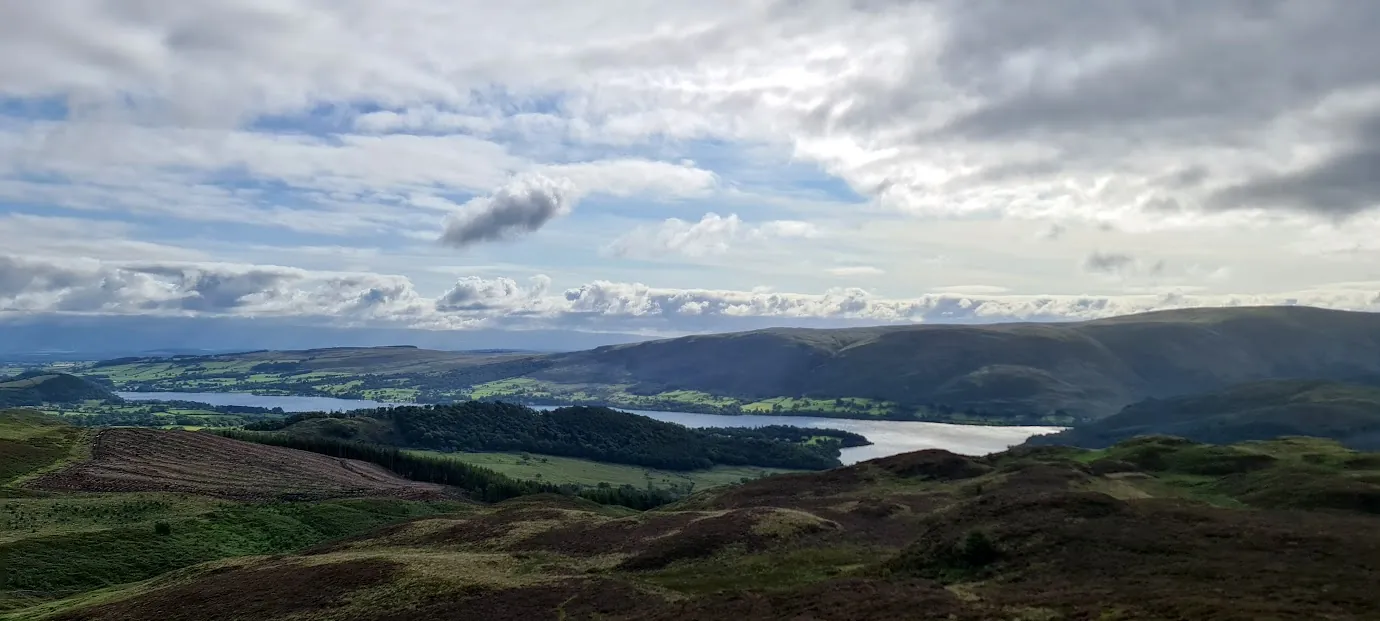
How busy it will be
Each figure is that car park measured against its own January — how much busier its own quietest month gets. It is not a comparison between car parks, and it cannot be: a small site and a large one can show the same swing.
| Car park | This month |
|---|---|
| Threlkeld | 1.4× |
How we know, and what we don’t claim
- This is climatology, not a forecast. It says what the odds have been, never what next week will do. For that, see conditions.
- One grid point, 11 years. A working baseline, not a 30-year normal, and the Lake District is not one grid square.
- Paid transactions are not visitors. A car park with free parking alongside, or one most people walk to, is undercounted.
- Every parking figure compares a site to itself, never to another site.
Spot a data error? Request a correction — every figure here is sourced and dated, and genuine mistakes are fixed promptly.